Inline Monitoring allows to get forwarding status codes for transit packets, as well as a sample of the packet itself -- even if the packet was dropped for whatever reason. By having the packet header exposed to a remote collector, this feature enables other nice applications like peering traffic visibility on a shared port, traffic anomaly detection and network performance observation.
Most of the experienced readers would know where to look for packet counters, so we'll list only some of the widely known commands. Even if packet counters don't always allow to understand the exact reason if a drop (and don't give us the headers of the packet either), they are a good start of a troubleshooting process:
There are a few other ways to get a packet mirrored for further analysis: plain packet mirroring, sflow, or flow tap. They differ in support for packet types (layer-2, layer-3) and sampling rates, and granularity of the packet matching. Still, they don't deliver metadata such as exception details, and packets dropped at early stages of processing would not be reported.
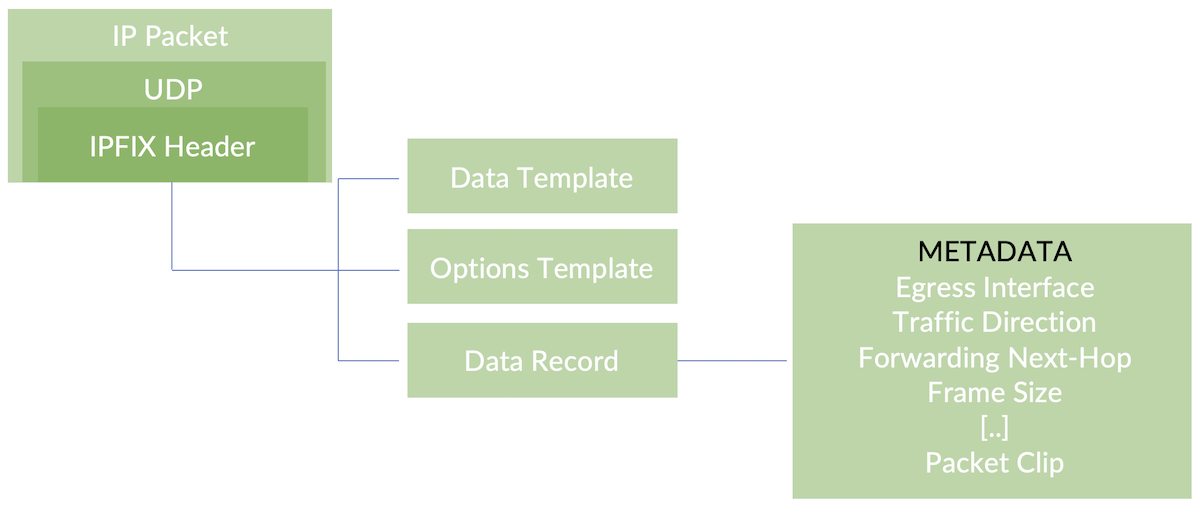
configuration for exporting a clip of exception packets, they will be part of "data records"
template configuration with definitions of data records fields, they are part of "data template record"
various options are reported as "options template record"
an instance of inline monitoring with configurable keys
collector definitions
an example filter with packet matches. Adjust it before activating on any interface, so that the filter matches necessary traffic only
interface with that filter applied on family any, direction ingress or egress. It is deactivated, as we do not intend to capture valid transit packets, though it is perfectly possible if you activate it.
Reporting exception packets does not require a firewall filter applied to an interface, the configuration is per PFE
Notes:
a collector needs to capture both data template and data packets to understand the flexible format of the IPFIX record
like in any traffic sampling scenario, using a firewall filter matching all packets is not a good idea -- unless you know what you are doing
if a filter is applied on egress direction, make sure you don't sample the IPFIX packets themselves -- exclude them in the filter!
RFC7011 defines three packet types used by IPFIX: data template record, options template record and data record. Why would we need all three? Well, at least for the automated decoding -- when we know the templates, we can dissect the data records themselves.
Figure 1: Exported Packet
If you have tshark, using -V flag will help look deeper into the decoded data.
Data template describes the fields carried by the data records:
[..] NetFlow/IPFIX
    Version: 10
    Length: 92
    Timestamp: Dec 27, 2023 14:27:57.000000000 UTC
        ExportTime: 1703687277
    FlowSequence: 0 (expected 9)
        [Expert Info (Warning/Sequence): Unexpected flow sequence for domain ID 33619968 (expected 9, got 0)]
            [Unexpected flow sequence for domain ID 33619968 (expected 9, got 0)]
            [Severity level: Warning]
            [Group: Sequence]
    Observation Domain Id: 33619968
    Set 1 [id=2] (Data Template): 384
        FlowSet Id: Data Template (V10 [IPFIX]) (2)
        FlowSet Length: 76
        Template (Id = 384, Count = 11)
            Template Id: 384
            Field Count: 11
            Field (1/11): OBSERVATION_DOMAIN_LEVEL_JUNIPER_COMMON_PROPERTIES
                1... .... .... .... = Pen provided: Yes
                .000 0000 1000 1001 = Juniper Resiliency: OBSERVATION_DOMAIN_LEVEL_JUNIPER_COMMON_PROPERTIES (137)
                Length: 4
                PEN: Juniper Networks, Inc. (2636)
            Field (2/11): OBSERVATION_DOMAIN_LEVEL_JUNIPER_COMMON_PROPERTIES
                1... .... .... .... = Pen provided: Yes
                .000 0000 1000 1001 = Juniper Resiliency: OBSERVATION_DOMAIN_LEVEL_JUNIPER_COMMON_PROPERTIES (137)
                Length: 2
                PEN: Juniper Networks, Inc. (2636)
            Field (3/11): OBSERVATION_DOMAIN_LEVEL_JUNIPER_COMMON_PROPERTIES
                1... .... .... .... = Pen provided: Yes
                .000 0000 1000 1001 = Juniper Resiliency: OBSERVATION_DOMAIN_LEVEL_JUNIPER_COMMON_PROPERTIES (137)
                Length: 4
                PEN: Juniper Networks, Inc. (2636)
            Field (4/11): OBSERVATION_DOMAIN_LEVEL_JUNIPER_COMMON_PROPERTIES
                1... .... .... .... = Pen provided: Yes
                .000 0000 1000 1001 = Juniper Resiliency: OBSERVATION_DOMAIN_LEVEL_JUNIPER_COMMON_PROPERTIES (137)
                Length: 4
                PEN: Juniper Networks, Inc. (2636)
            Field (5/11): OBSERVATION_DOMAIN_LEVEL_JUNIPER_COMMON_PROPERTIES
                1... .... .... .... = Pen provided: Yes
                .000 0000 1000 1001 = Juniper Resiliency: OBSERVATION_DOMAIN_LEVEL_JUNIPER_COMMON_PROPERTIES (137)
                Length: 4
                PEN: Juniper Networks, Inc. (2636)
            Field (6/11): OBSERVATION_DOMAIN_LEVEL_JUNIPER_COMMON_PROPERTIES
                1... .... .... .... = Pen provided: Yes
                .000 0000 1000 1001 = Juniper Resiliency: OBSERVATION_DOMAIN_LEVEL_JUNIPER_COMMON_PROPERTIES (137)
                Length: 4
                PEN: Juniper Networks, Inc. (2636)
            Field (7/11): INPUT_SNMP
                0... .... .... .... = Pen provided: No
                .000 0000 0000 1010 = Type: INPUT_SNMP (10)
                Length: 4
            Field (8/11): OUTPUT_SNMP
                0... .... .... .... = Pen provided: No
                .000 0000 0000 1110 = Type: OUTPUT_SNMP (14)
                Length: 4
            Field (9/11): DIRECTION
                0... .... .... .... = Pen provided: No
                .000 0000 0011 1101 = Type: DIRECTION (61)
                Length: 1
            Field (10/11): dataLinkFrameSize
                0... .... .... .... = Pen provided: No
                .000 0001 0011 1000 = Type: dataLinkFrameSize (312)
                Length: 2
            Field (11/11): dataLinkFrameSection
                0... .... .... .... = Pen provided: No
                .000 0001 0011 1011 = Type: dataLinkFrameSection (315)
                Length: 65535 [i.e.: "Variable Length"]
    [Expected Sequence Number: 9]
    [Previous Frame in Sequence: 3]
Output 1: Data Template
Observation Domain ID is an identifier of the observation point, for example referring to a chassis. In this case it's automatically generated.
Fields 1 to 6 have the Element ID of 137 (Common Properties ID), associated with Juniper's Private Enterprise Number 2636 allocated by IANA. The left-most 6 bits are encoding a common property ID (CP-ID) from Juniper, followed by reserved 0 bits. That's why when looking at the hex dump, one would see 0x4, which is a value of 1 in the left-most 6 bits.
The remaining fields 7 to 11 have well-known Element ID related to the purpose of the respective field.
Finally, let us check the data received. Below is just the frame containing the data record. You will see that a relatively modern tshark (I used ubuntu 22.04 LTS) can very well understand both IPFIX headers as well as decode the payload!
aelita@pe2# run show interfaces | match 576
  Logical interface ge-0/0/0.0 (Index 360) (SNMP ifIndex 576)
Now we know the interface details and some other metadata of the transit packet and can proceed to analyze the packet itself (using same output above coming from tshark packet decoder):
Ethernet Frame, Destination and Source MACs, Protocol ID 0x8847 (MPLS)
That is a great insight, we know that this packet caused an exception, and even the exact content of the packet!
Why was there an exception created? We need to understand what the exception code 194 means.
In Junos, on MX series of routers, there are counters associated with exceptions of type discard and punt. There are many reasons for discard, for example dropping packets where the route to destination does not exist (or explicitly points to the discard interface), VLAN mismatch, wrong destination MAC, bad IP headers and many other reasons and counters associated with them. A punted packet is sent to the upper layers for further processing, for example control traffic directed to the router itself, or when there is a need to resolve next-hop like ARP, or various subscriber packets like PPPoE -- again, counters associated with those and other similar actions.
aelita@pe2> request pfe execute target fpc0 command "show jnh 0 exceptions terse"
SENT: Ukern command: show jnh 0 exceptions terse


Reason                             Type           Packets      Bytes
==================================================================


PFE State Invalid
----------------------
unknown family                     DISC( 73)           42       3002


Packet Exceptions
----------------------
IP options                         PUNT(  2)            2         64


Routing
----------------------
discard route                      DISC( 66)        29230    2046300
hold route                         DISC( 70)         4377     482852
resolve route                      PUNT( 33)        16805    1494766
control pkt punt via nh            PUNT( 34)        36482    5778200
host route                         PUNT( 32)        55951    4855476
Output 4: Exceptions List
The list is short as it shows only non-zero counters. For the full list, remove "terse". The "type" column shows the type (discard or punt) and the forwarding status code. Status codes reported via IPFIX have an offset of +128, so that the reported status code 194 is equal to 66 in the PFE output above (194-128=66), i.e., a discard route.
A quick validation on the label 1000001 in the FIB confirms it will be discarded:
The above is a patch to the previous configuration -- you can paste it using "load patch terminal" in the configuration mode. This is somewhat less known (but very useful!) way to load the diff directly.
Please note that on-box collector configuration must specify a locally configured "destination-address" and the port must be 4739.
The log fille (in CLI: "show log jri-fwd.log") will quickly be populated with the same three distinct types of IPFIX reports.
Among other metadata like interface details, we see that the reported packet took a "Discard Route": the forwarding status code of 194 has automatically been decoded for human eyes.
However, the packet itself is represented as a sequence of hex bytes, and needs further decoding for a better understanding.
There are a few online decoders available, but why not do that in a shell of e.g. a linux-based computer like this:
Then just paste the hex code followed by EOF on an empty line and see the results. The magic happens by converting hex bytes to a hex dump (function of xxd and od), generating a pcap from the hex dump (text2pcap) and a verbose decoding of the pcap (tshark).
For the off-box collection if IPFIX with metadata, goflow2 or pmacct can be used. I will use goflow2 as an example here -- just to give an idea how an off-box collector could be implemented.
The whole telecommunications industry is moving fast towards reliable and robust automated networks. Being able to quickly determine any malfunctioning component is a key element in that journey.
Juniper MX and PTX devices can use their ASIC capabilities to generate inline monitoring of the transit traffic, without adverse effects on the line-card or central processing unit. IPFIX format is ASIC-friendly, and flexible to accommodate ever growing list of exported elements.